Using a year-adjusted metric: for each field I averaged how many bu/ac it ran above or below the whole farm's average for that crop, that season — so weather years cancel out. Positive = beats the farm; negative = trails it. Fields needed 4+ harvested seasons of each crop; 21 qualify.
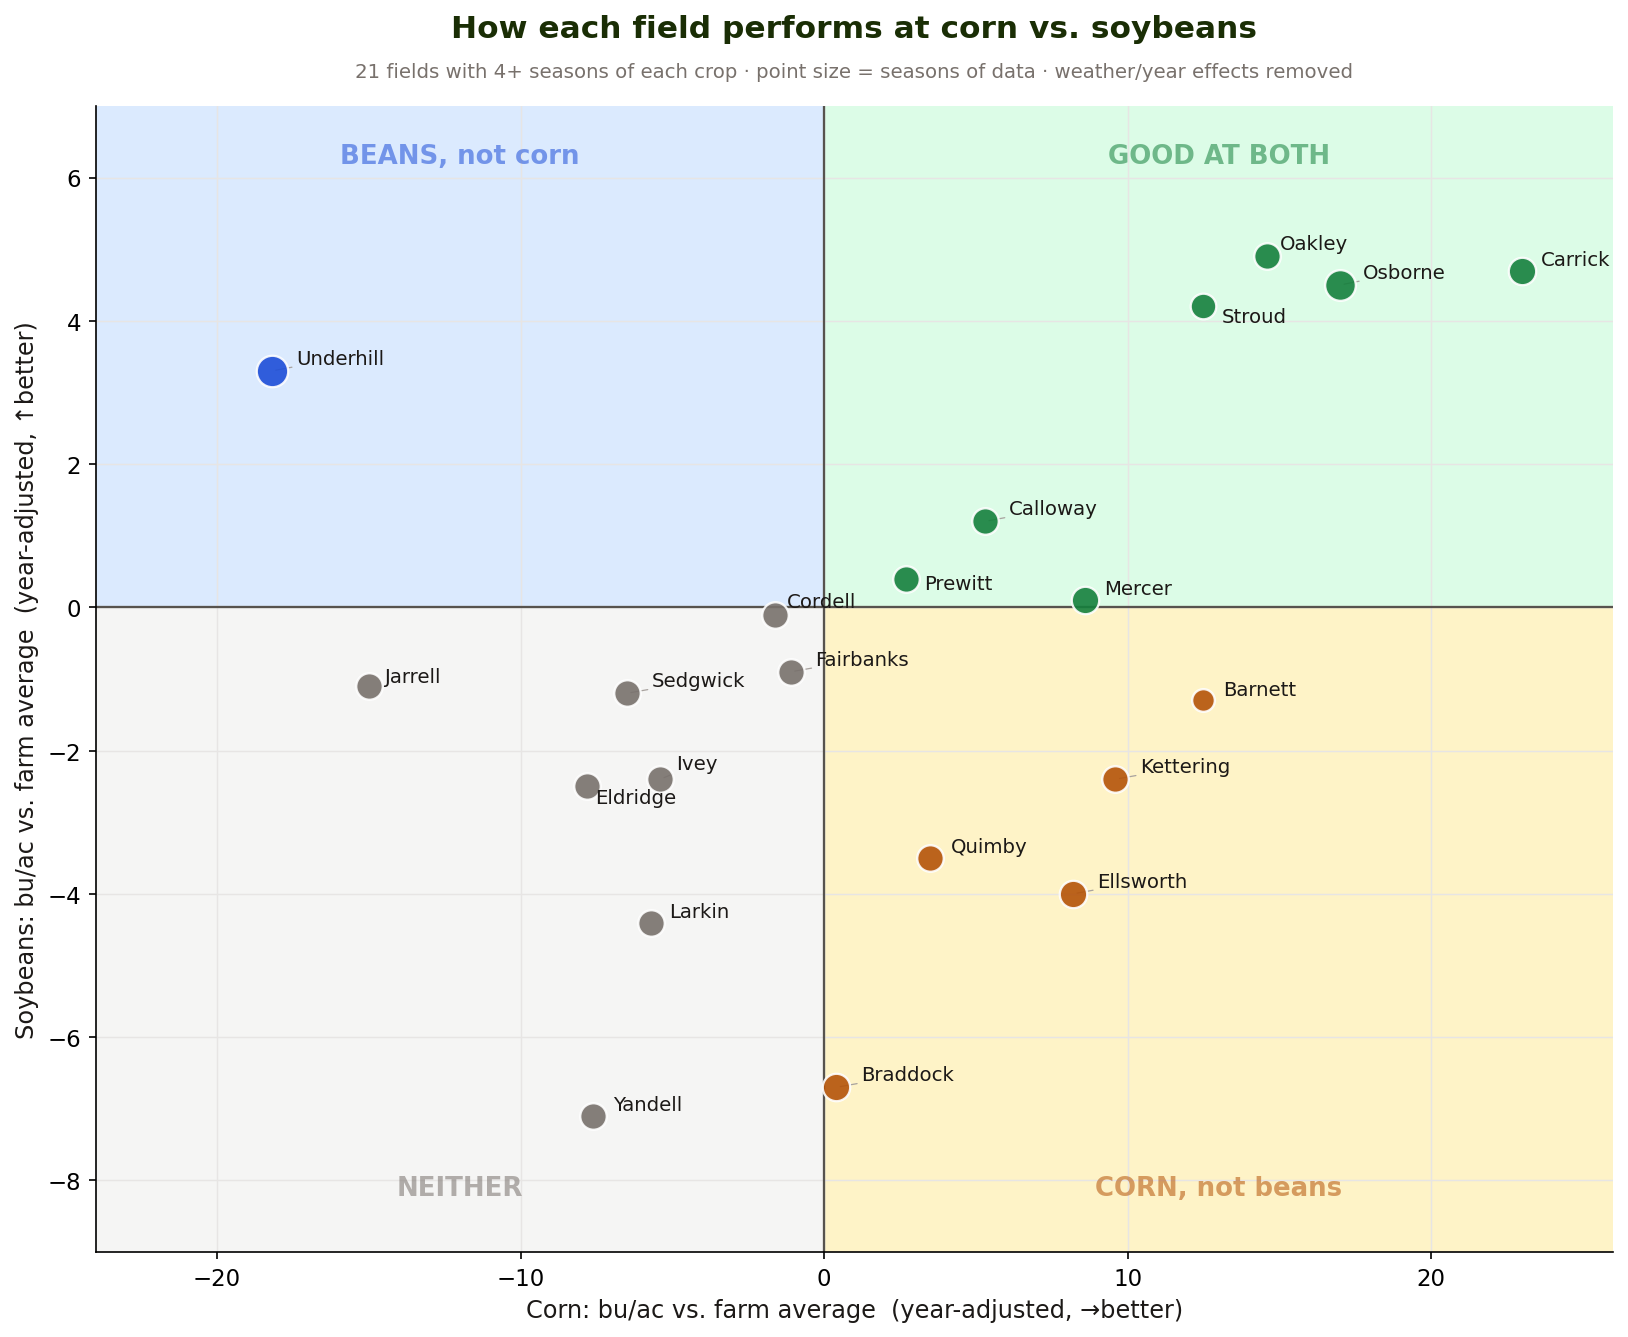
The verdict by field:
Good at both (9): Carrick and Osborne are your standouts — Carrick runs +26 bu/ac corn and +5 beans over the farm average. Then Stroud, Oakley, Barnett, Calloway, Prewitt, and marginally Fairbanks and Cordell (barely above the line).
Corn only (4): Kettering (+12.5 corn, −1.5 beans), Quimby, Ellsworth, and Mercer — Mercer is a clear split personality: solid corn (+3.6) but your worst bean field (−9.9).
Soybean only (1): Underhill — your most lopsided field. It's the worst corn ground on the farm (−16 bu/ac) but a genuinely good bean field (+3), across a lot of seasons (12 corn, 6 beans). If you're rotating that one, it's telling you to lean beans.
Neither (7): Ivey, Sedgwick, Larkin, Eldridge, Braddock, Jarrell, Yandell all trail on both. Yandell and Braddock are the softest overall.
One thing to keep in mind: corn deviations span a wider range (±25) than beans (±10) simply because corn yields are ~4× larger, so a field can look more dramatic on the corn axis. The signs are what drive the classification, and Underhill is the one field where the two crops genuinely disagree.
Want me to dig into why Underhill is so corn-averse — check whether it's planting date, a drainage/wet-spot pattern, or planter error dragging its corn stands?