Troubleshooting skipped planting strips.
How we help a grower understand a section-control error causing missed planting across 20 acres of their fields.
Troubleshooting skipped planting strips.
How we help a grower understand a section-control error causing missed planting across 20 acres of their fields.
The gist
The section control signal was switched between sections 2 and 3 on a grower’s soybean drills, causing skipped and double-planted strips throughout the grower’s fields whenever the two sections were commanded different rates.
We produced maps and tables to assist the grower in locating, troubleshooting, and quantifying the magnitude of the problem.
The grower was able to use this data to receive compensation from the drill dealer and manufacturer.
The story
Mysterious strips
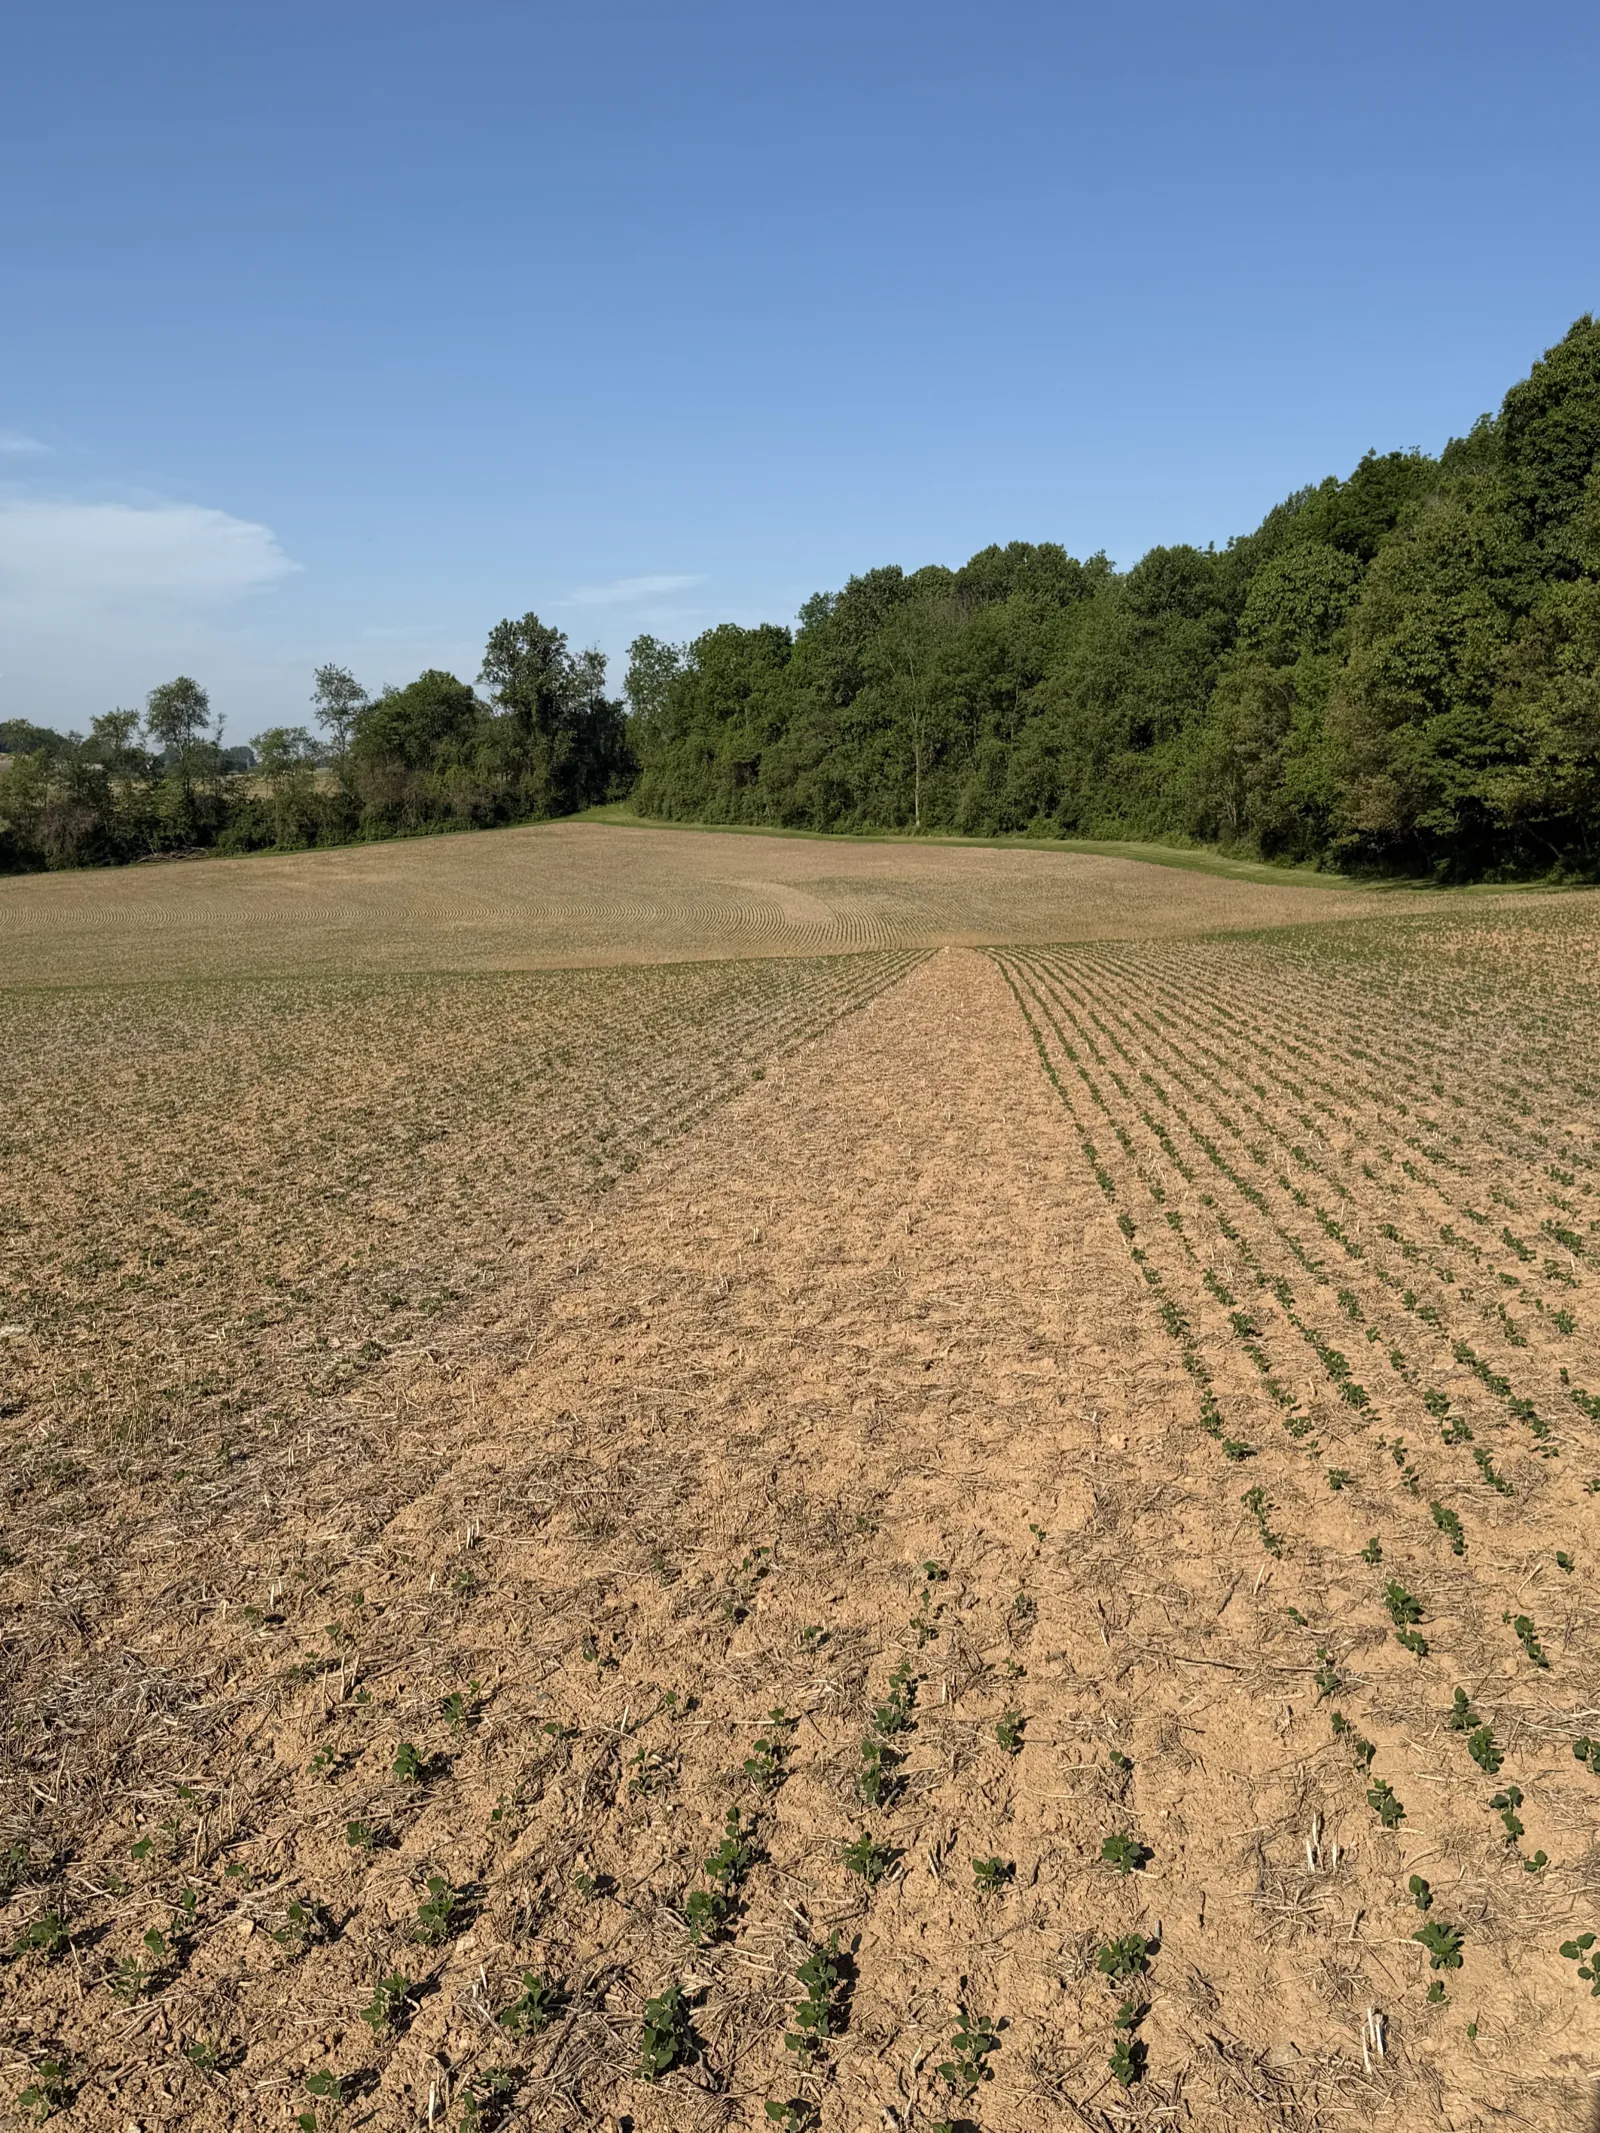
One morning we received a call from a grower we were supporting about strips of missing soybeans. He was scouting his fields after emergence and noticed that two of his fields had narrow strips where he expected soybeans to be planted, but none had emerged.
 |
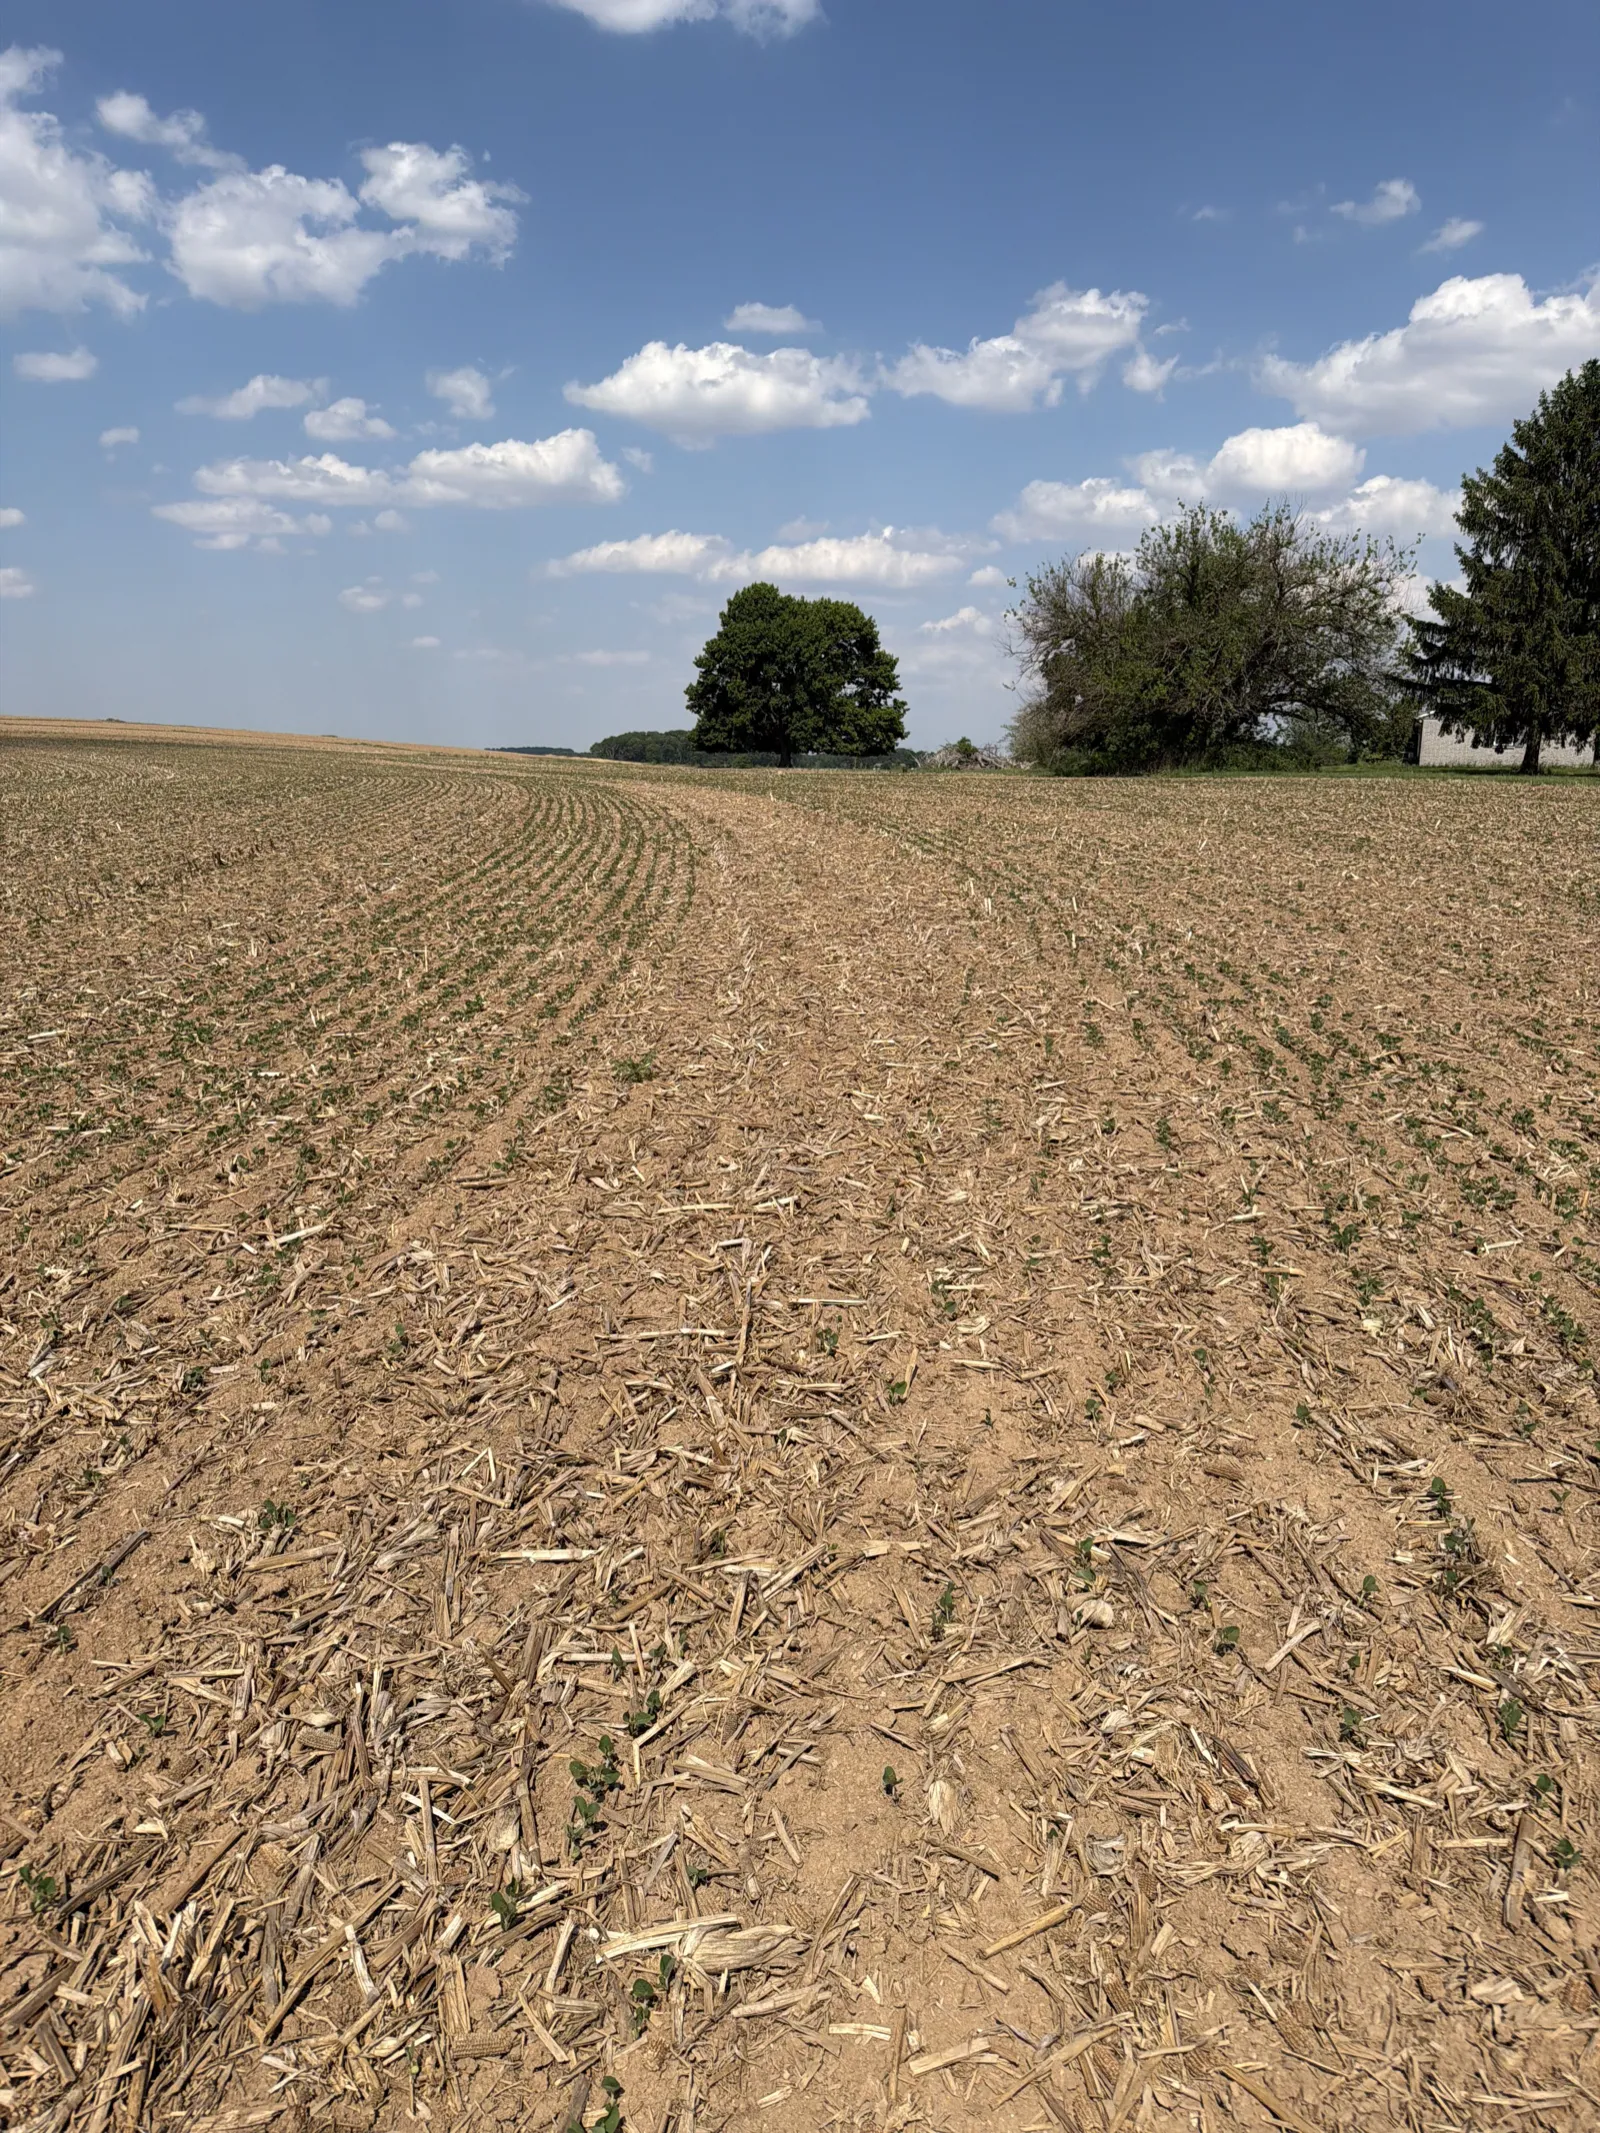 |
He immediately suspected a section control issue – both of the strips were 10 ft wide (the width of one section of his soybean drill), and they were both close to the headlands – but he wasn’t sure how large this problem was or what could be causing it. He called us to see if we could help him map out where it was happening, allowing him to better troubleshoot the problem and determine exactly how many acres it affected.
Identifying the root cause
Finding the problem areas
We jumped on the job, and immediately asked our system to create a map of all section control acres in the field he was currently scouting making sure to highlight the various section control widths in various colors: 1 section planting, highlight red; 2 sections planting, highlight orange; 3 sections planting, highlight yellow; 4 sections planting (section control off), highlight green.
This was the resulting map.
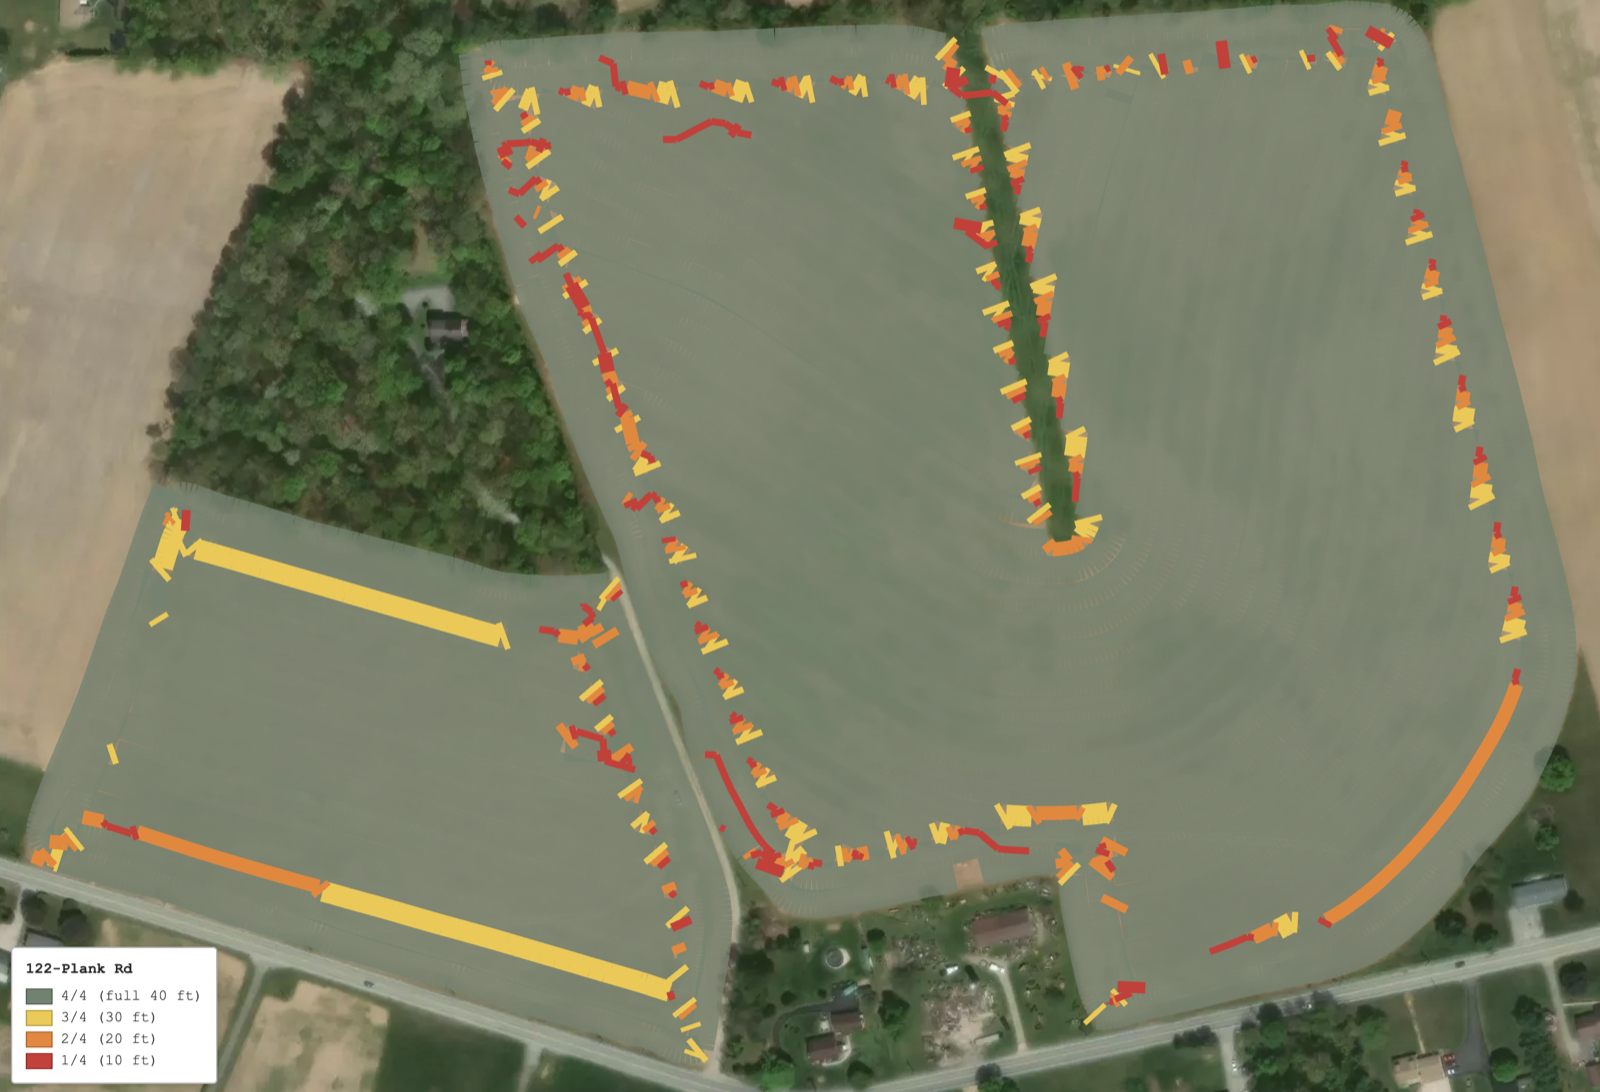
There was a lot of noise in this map from the section control being active in the headlands, but there were 4 obvious strips that stood out worth scouting in this field: 2 yellow ones on the left field (both with 3 sections active), an orange strip on the left field, and an orange strip on the right field (both with 2 sections active).
The grower visited each of these spots and reported back:
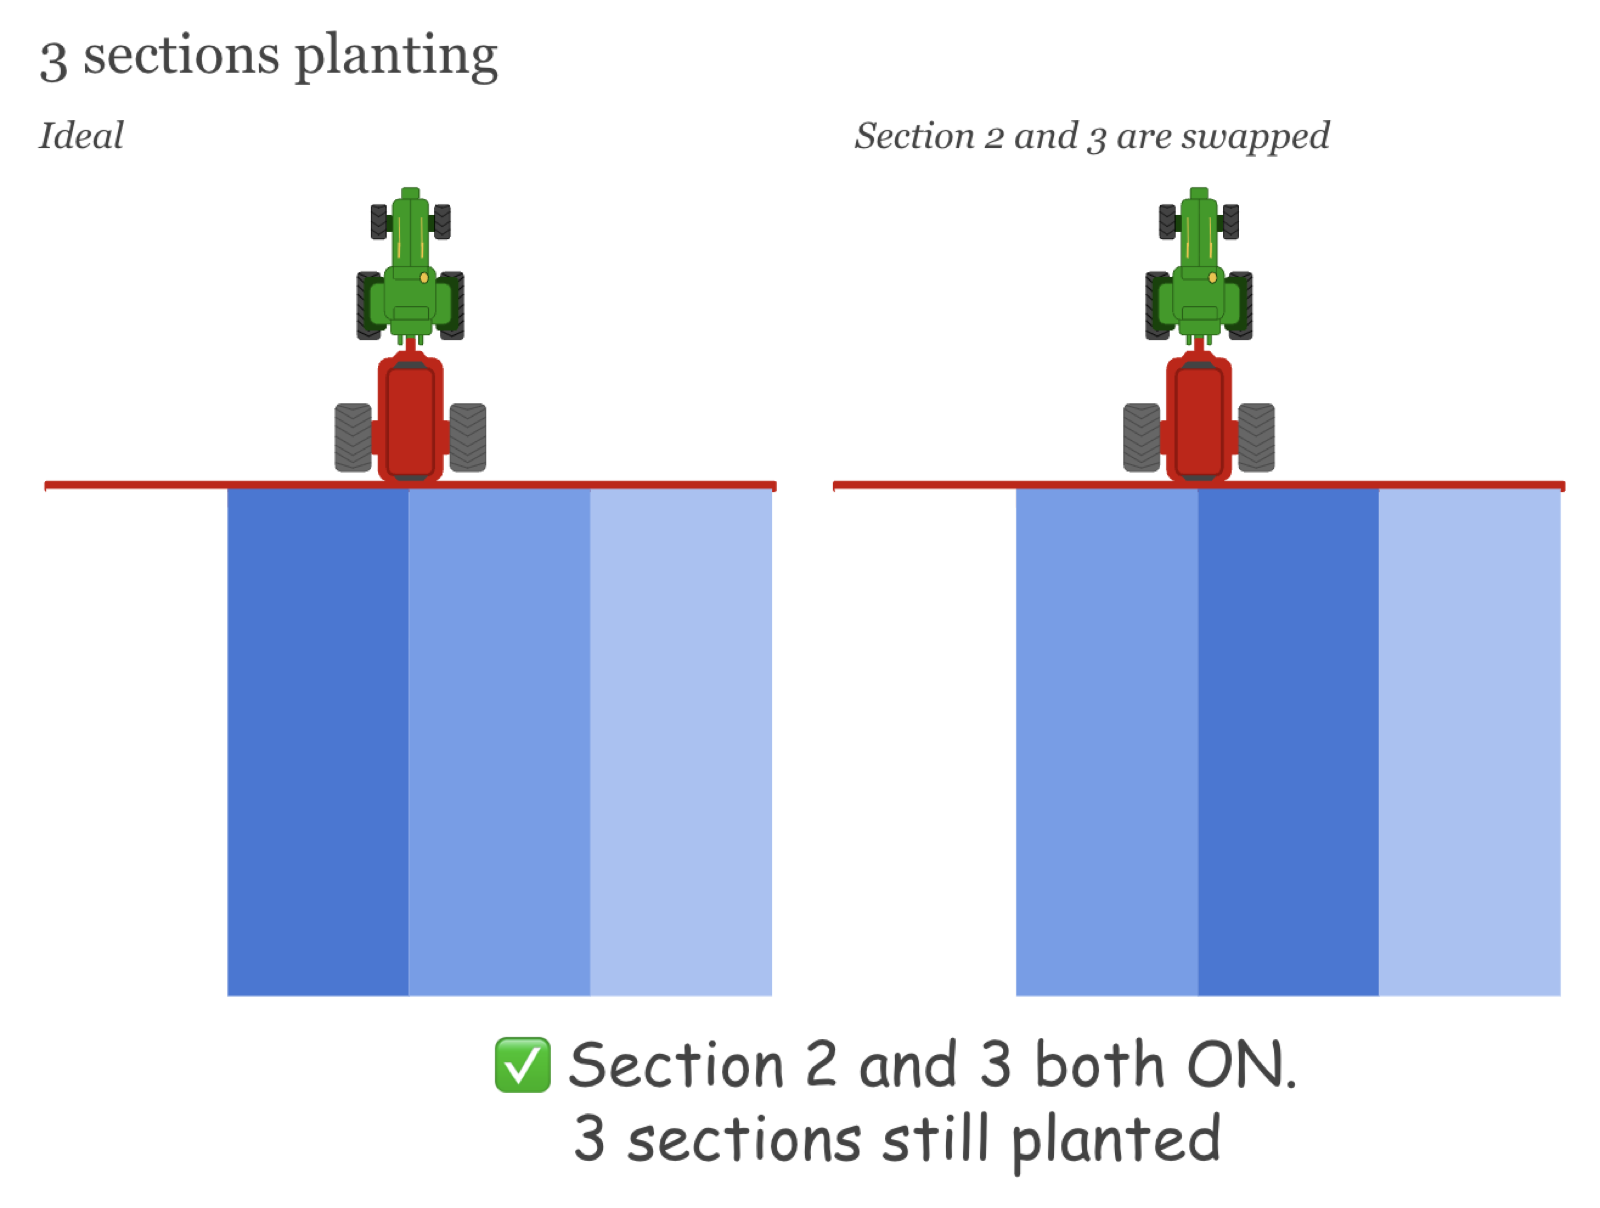
Neither of the yellow, 3 active section areas had skipped strips.
Both of the orange, 2 active section areas had skipped strips.
A small orange section he walked past on the way had skipped strips.
He didn’t see any missing strips near the red, 1 active section, areas, but they were also too small to tell.
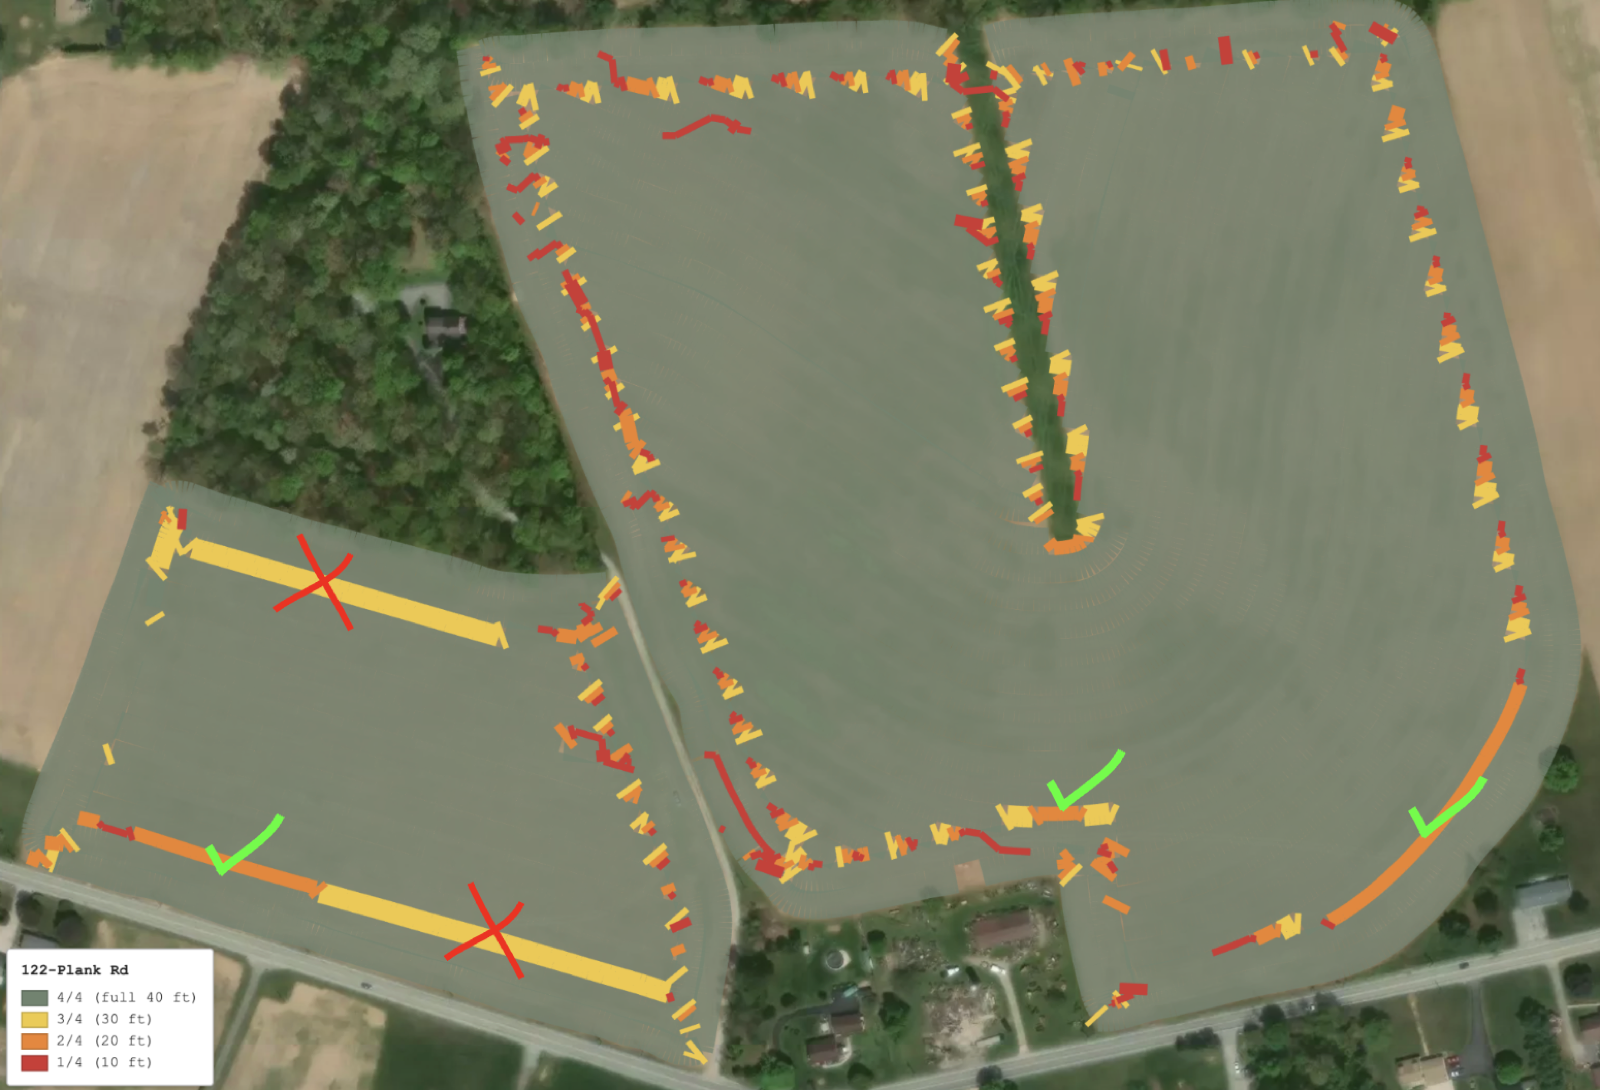
We generated these maps for a few more fields for the grower to scout and a pattern emerged:
3 active sections acres (yellow): No missing strip
2 active section areas (orange): Missing strips
1 active section areas (red): No missing strips
While scouting more of these sections, he also noticed a pattern. Every skipped strip seemed to have a harder to notice double-planted strip next to it…
There was a eureka moment! Two section control sections probably got swapped, and it was probably section 2 and 3.
The root cause
To understand, it’s worth explaining the problem more thoroughly.
The grower’s drills are 40 ft wide drills with four independently controlled 10 ft sections.
At the start of the season, the drills had their sections calibrated by the dealer using a manufacturer-defined procedure.
Unbeknownst to the grower or the dealer, the calibration process was flawed and caused section 2 and 3 to have their control signals swapped.
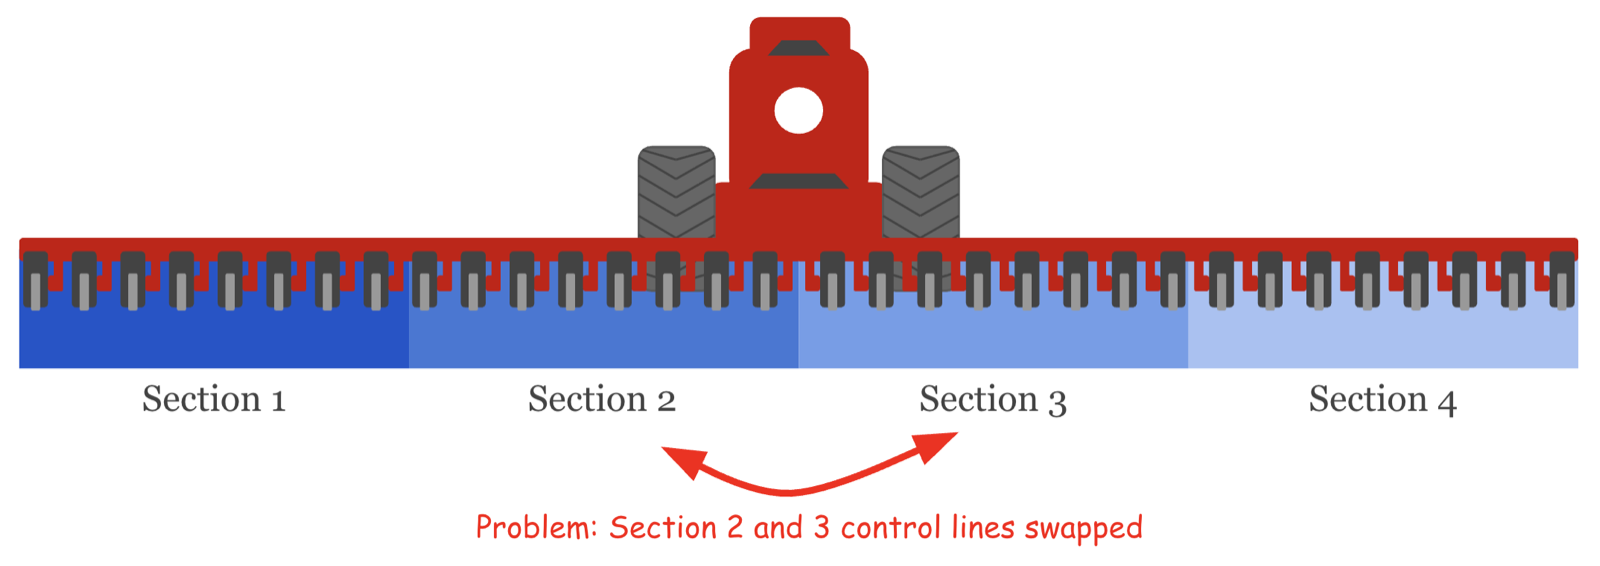
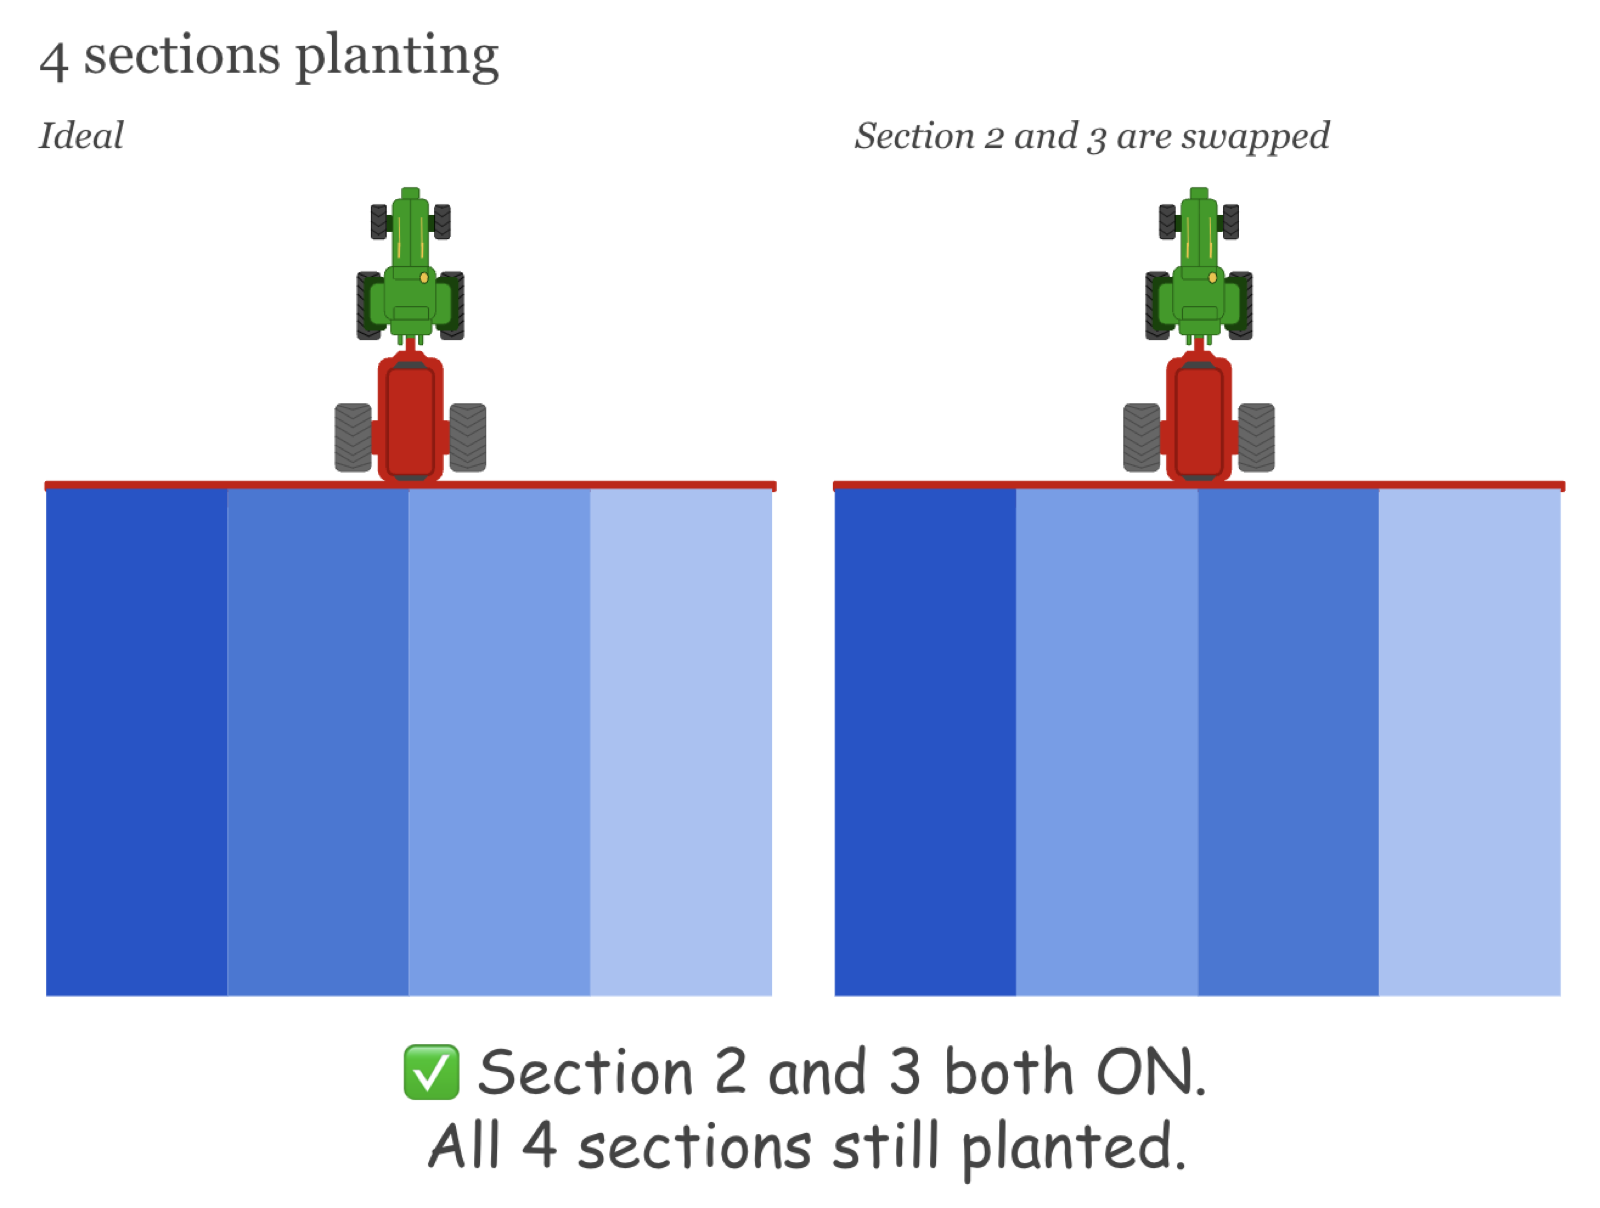
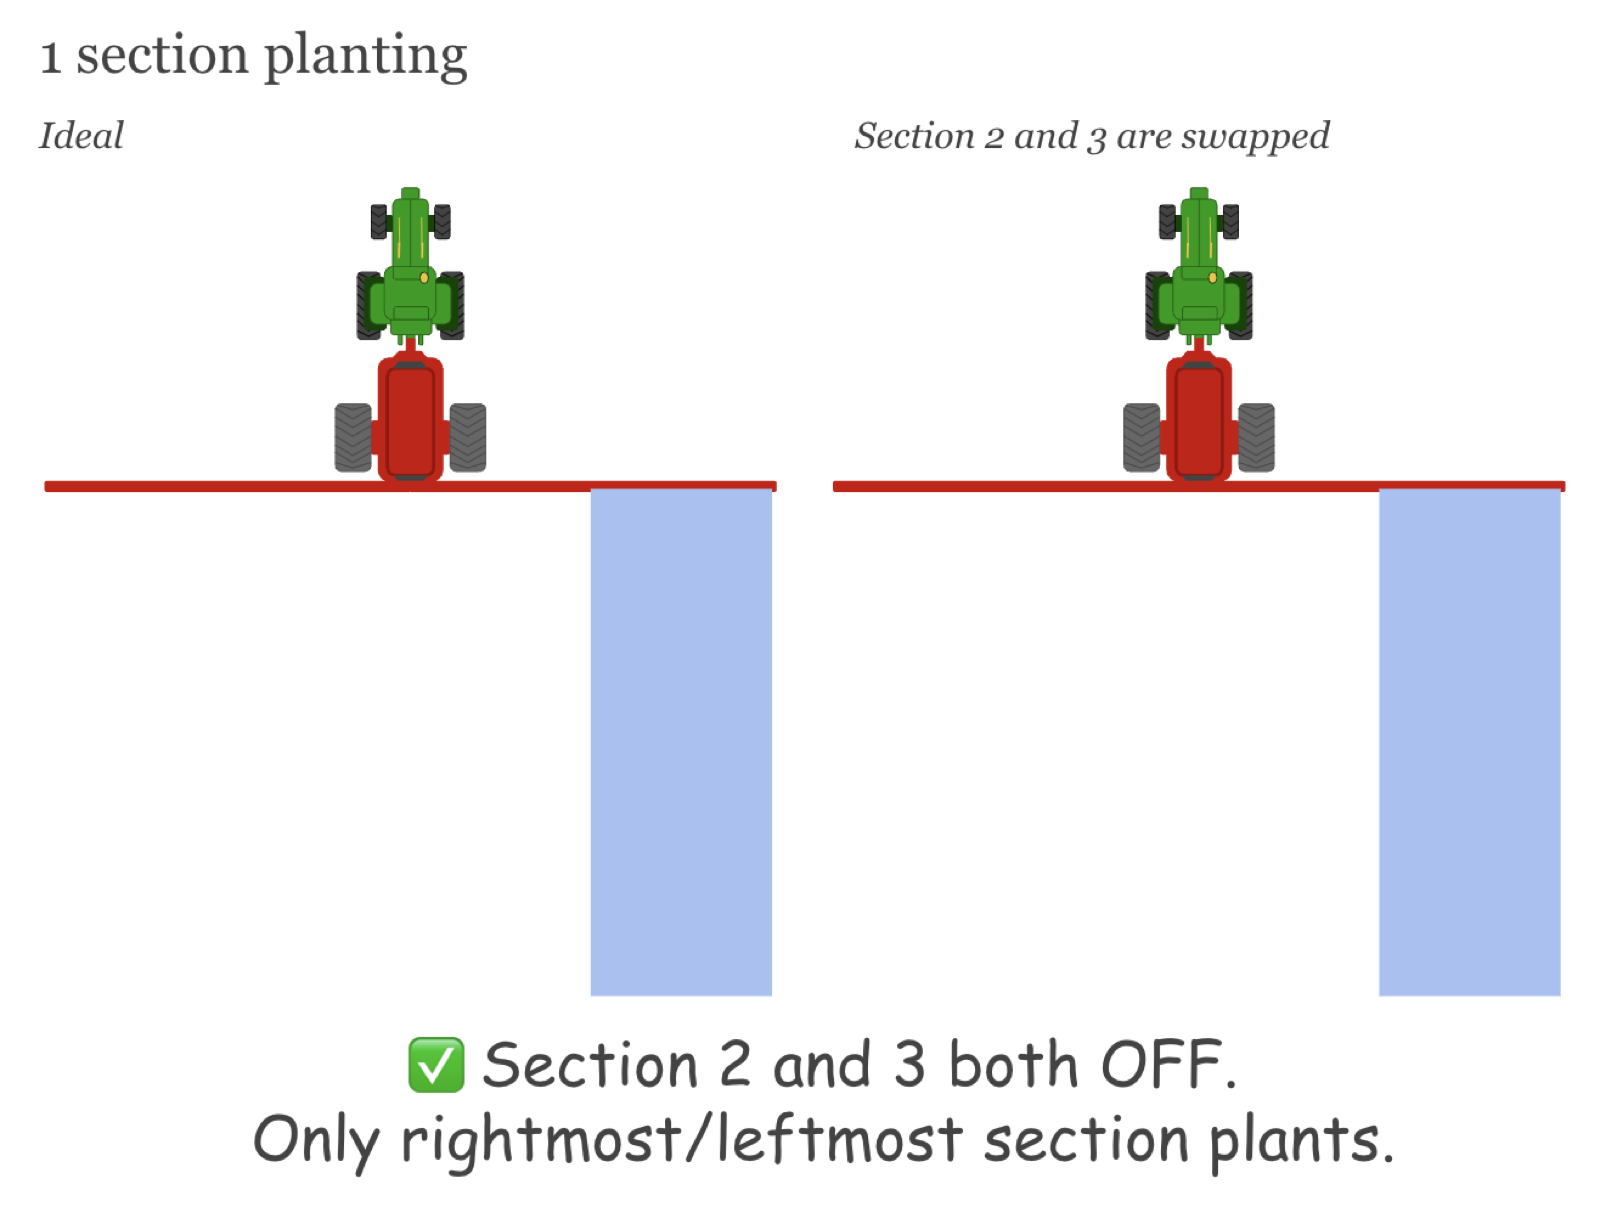
Most of the time, this wasn’t an issue. If sections 2 and 3 are both commanded the same signal (i.e. Both ON or both OFF), they had the same outcome, regardless of the signal swap. However, if the two sections received opposite signals (i.e. section 2 ON and section 3 OFF), then the two sections do the opposite of what they’re supposed to do.
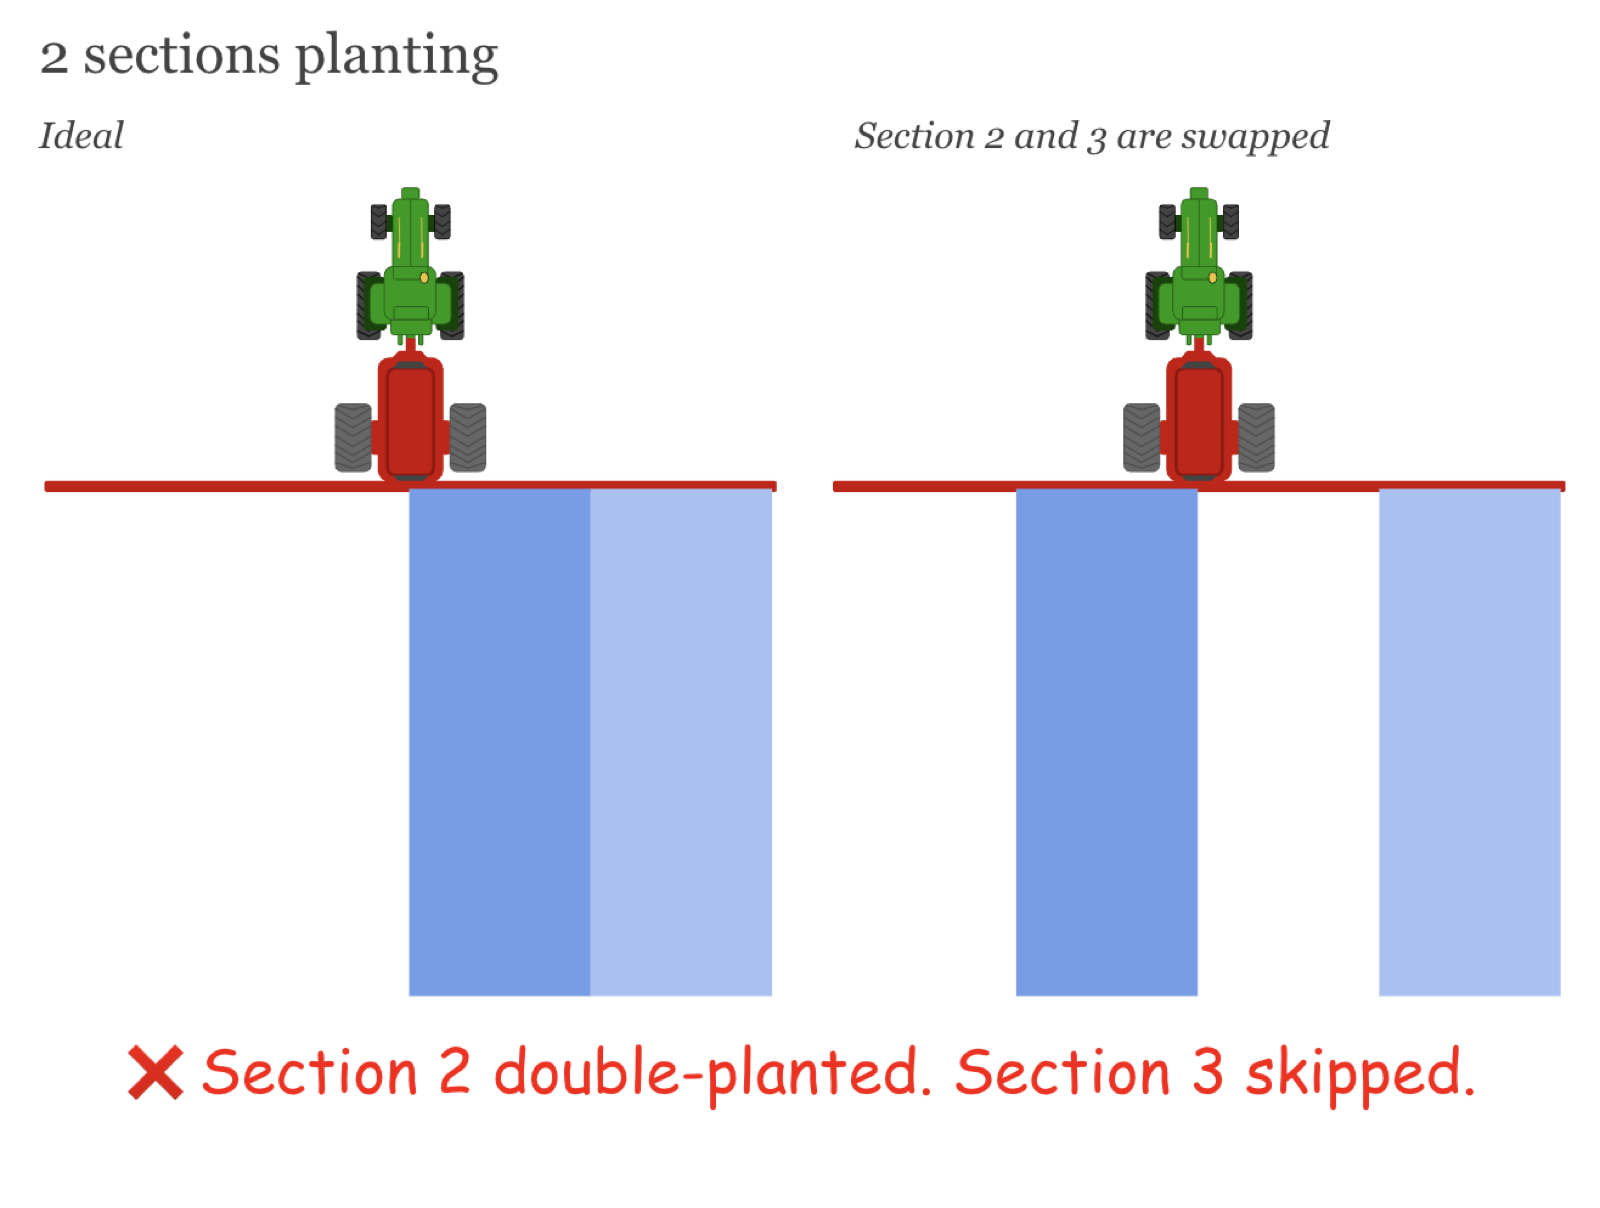
For example, if section control is commanding the left half of the planter OFF (including section 2) and the right half ON (including section 3), the actual behavior will keep section 2 planting and cut section 3 planting. This causes the section 2 section to plant into an area that already has seed (double-planting a strip), while having section 3 not plant over ground that currently doesn’t have seed (missing a strip).
 |
 |
 |
 |
This was exactly what was happening to the grower and why in all of the orange, 2 section areas, we found a skipped strip and a double-planted strip.
Verifying the root cause
With this pretty confident hunch, the grower decided to get the dealer and the manufacturer involved. The manufacturer flew out and confirmed exactly what the grower and us had identified. The control signals for sections 2 and 3 were swapped, and it was because of a poor calibration procedure.
The dealership and manufacturer accepted responsibility, and offered to compensate the grower. Now it was time to estimate the damages and make a claim.
Quantifying the cost of the problem
Once we knew the cause of the problem, we could precisely search for the occurrences of the problem: Section 2 and 3 being sent different signals.
We summarized the results in a table counting the number of affected acres and fields, with linked maps to verify the strips.
| # | Field | Total acres | Affected acres | Affected % |
|---|---|---|---|---|
| 1 | Cedar Ridge | 151.3 | 3.16 | 2.09% |
| 2 | Three Pines | 121.7 | 2.92 | 2.40% |
| 3 | Mill Creek | 129.5 | 2.88 | 2.23% |
| 4 | Stonewall | 130.6 | 2.47 | 1.89% |
| 5 | South Bend | 65.5 | 2.33 | 3.56% |
| 6 | Oak Hollow | 101.6 | 2.28 | 2.25% |
| 7 | Foxden Road | 97.4 | 1.93 | 1.98% |
| 8 | Twin Oaks | 70.1 | 1.63 | 2.33% |
| 9 | Briar Patch | 52.0 | 1.55 | 2.99% |
| 10 | East Meadow | 109.9 | 1.44 | 1.31% |
| 11 | Hilltop Mill | 50.9 | 1.28 | 2.52% |
| 12 | Walnut Grove | 73.5 | 1.27 | 1.73% |
| 13 | Mason Knob | 51.0 | 1.25 | 2.45% |
| 14 | Stone Bridge | 56.4 | 1.19 | 2.11% |
| 15 | Bowman Field | 40.5 | 1.16 | 2.86% |
| 16 | Schoolhouse | 48.7 | 1.13 | 2.32% |
| 17 | Maple Run | 54.2 | 1.11 | 2.06% |
| 18 | Pinewood | 43.6 | 1.02 | 2.35% |
| 19 | Whitehall | 46.6 | 0.96 | 2.05% |
| 20 | Boundary | 85.7 | 0.95 | 1.11% |
| 21 | Clarke Hollow | 48.5 | 0.94 | 1.93% |
| 22 | Hunters Pond | 36.7 | 0.89 | 2.42% |
| 23 | Bayberry | 45.7 | 0.78 | 1.72% |
| 24 | Quaker Run | 46.2 | 0.70 | 1.51% |
| 25 | Indian Spring | 38.0 | 0.68 | 1.80% |
| 26 | Riverbend | 22.8 | 0.63 | 2.74% |
| 27 | Locust Lane | 78.9 | 0.62 | 0.78% |
| 28 | Otter Lake | 21.5 | 0.53 | 2.44% |
| 29 | Shady Acres | 13.5 | 0.45 | 3.35% |
| 30 | Brookside | 23.4 | 0.41 | 1.76% |
| 31 | Maple Hill | 11.0 | 0.11 | 0.99% |
| 32 | Wilson Pond | 75.6 | 0.02 | 0.02% |
| Total (32 fields) | 2,042.5 | 40.67 | 1.99% |
Using these affected acre numbers, the grower could estimate the expected yield hit, the wasted machine hours, the replant seed cost, and make an informed compensation case to dealer and manufacturer.
The quantification alternative:
If the grower didn’t have this tool, they’d be left figuring out the numbers themselves. Before this tool, the grower’s original plan was to:
Manually scout each acre keeping track of each skipped area (likely only finding the large strips).
Replant all the skipped areas and keep track of the total used seed.
Use the total consumed seed and the planting density to estimate the total acres covered.
Round up a bit assuming he missed some spots.
Give the dealer and manufacturer his magic number.
Needless to say, that’s a lot more work for a less accurate number.
The future
This is a valuable problem to solve, and one we want to support. The grower will likely be compensated thousands of dollars, and they were able to do this by understanding the problem well enough to isolate the problem and estimate the magnitude. But it’s a workflow we can improve. We don’t want to be the middlemen between the grower and the information in their data. With this case study, we can see where the market may be headed.
This is good AI
This is also a great case study of AI doing a job in agriculture well:
- Without AI, these problem-specific maps and tables would not be possible. It’s not worth a software developer’s time to pull the data and build the maps for a couple thousand dollar problem. And it’s not worth a grower’s time to wait for a software developer to create these maps. This level of problem-specificity is only enabled by our ability to use AI to create these maps quickly with minimal developer time (~10 minutes of our time).
- This is AI empowering, not replacing, a grower. The AI did not replace the grower. The AI did not even replace thinking for the grower. It provided the grower information to think more and understand the problem better. It made the grower smarter, and that allowed the grower to use their time better and farm more efficiently.
Where do we fit in?
We don’t envision ourselves being the interface for growers when they have a problem like this. We envision a world, where the grower can pull up their phone, ask their question, and get their requested information immediately. We’re still frustratingly far from this. Creating the above artifacts requires a strong understanding of the data structure, and a strong opinion on the desired artifact. That’s a lot to expect from a farmer who also has to wear ten other hats.
We believe we can close this gap by doing our job better. Building better infrastructure, tooling, instructions that allow the farmer to get what they want with only the current context in their head. That’s our goal. Build the layer between the farmer and their data that allows the farmer to get the information they want, with the current understanding in their head.